Ask in natural language
Ask questions as you would ask a colleague. No SQL, no dashboards and no technical knowledge.
Engibots' conversational data analysis platform. No SQL, no rigid dashboards, no depending on the data team.
EngiAnalytics · Conversational Data Analysis
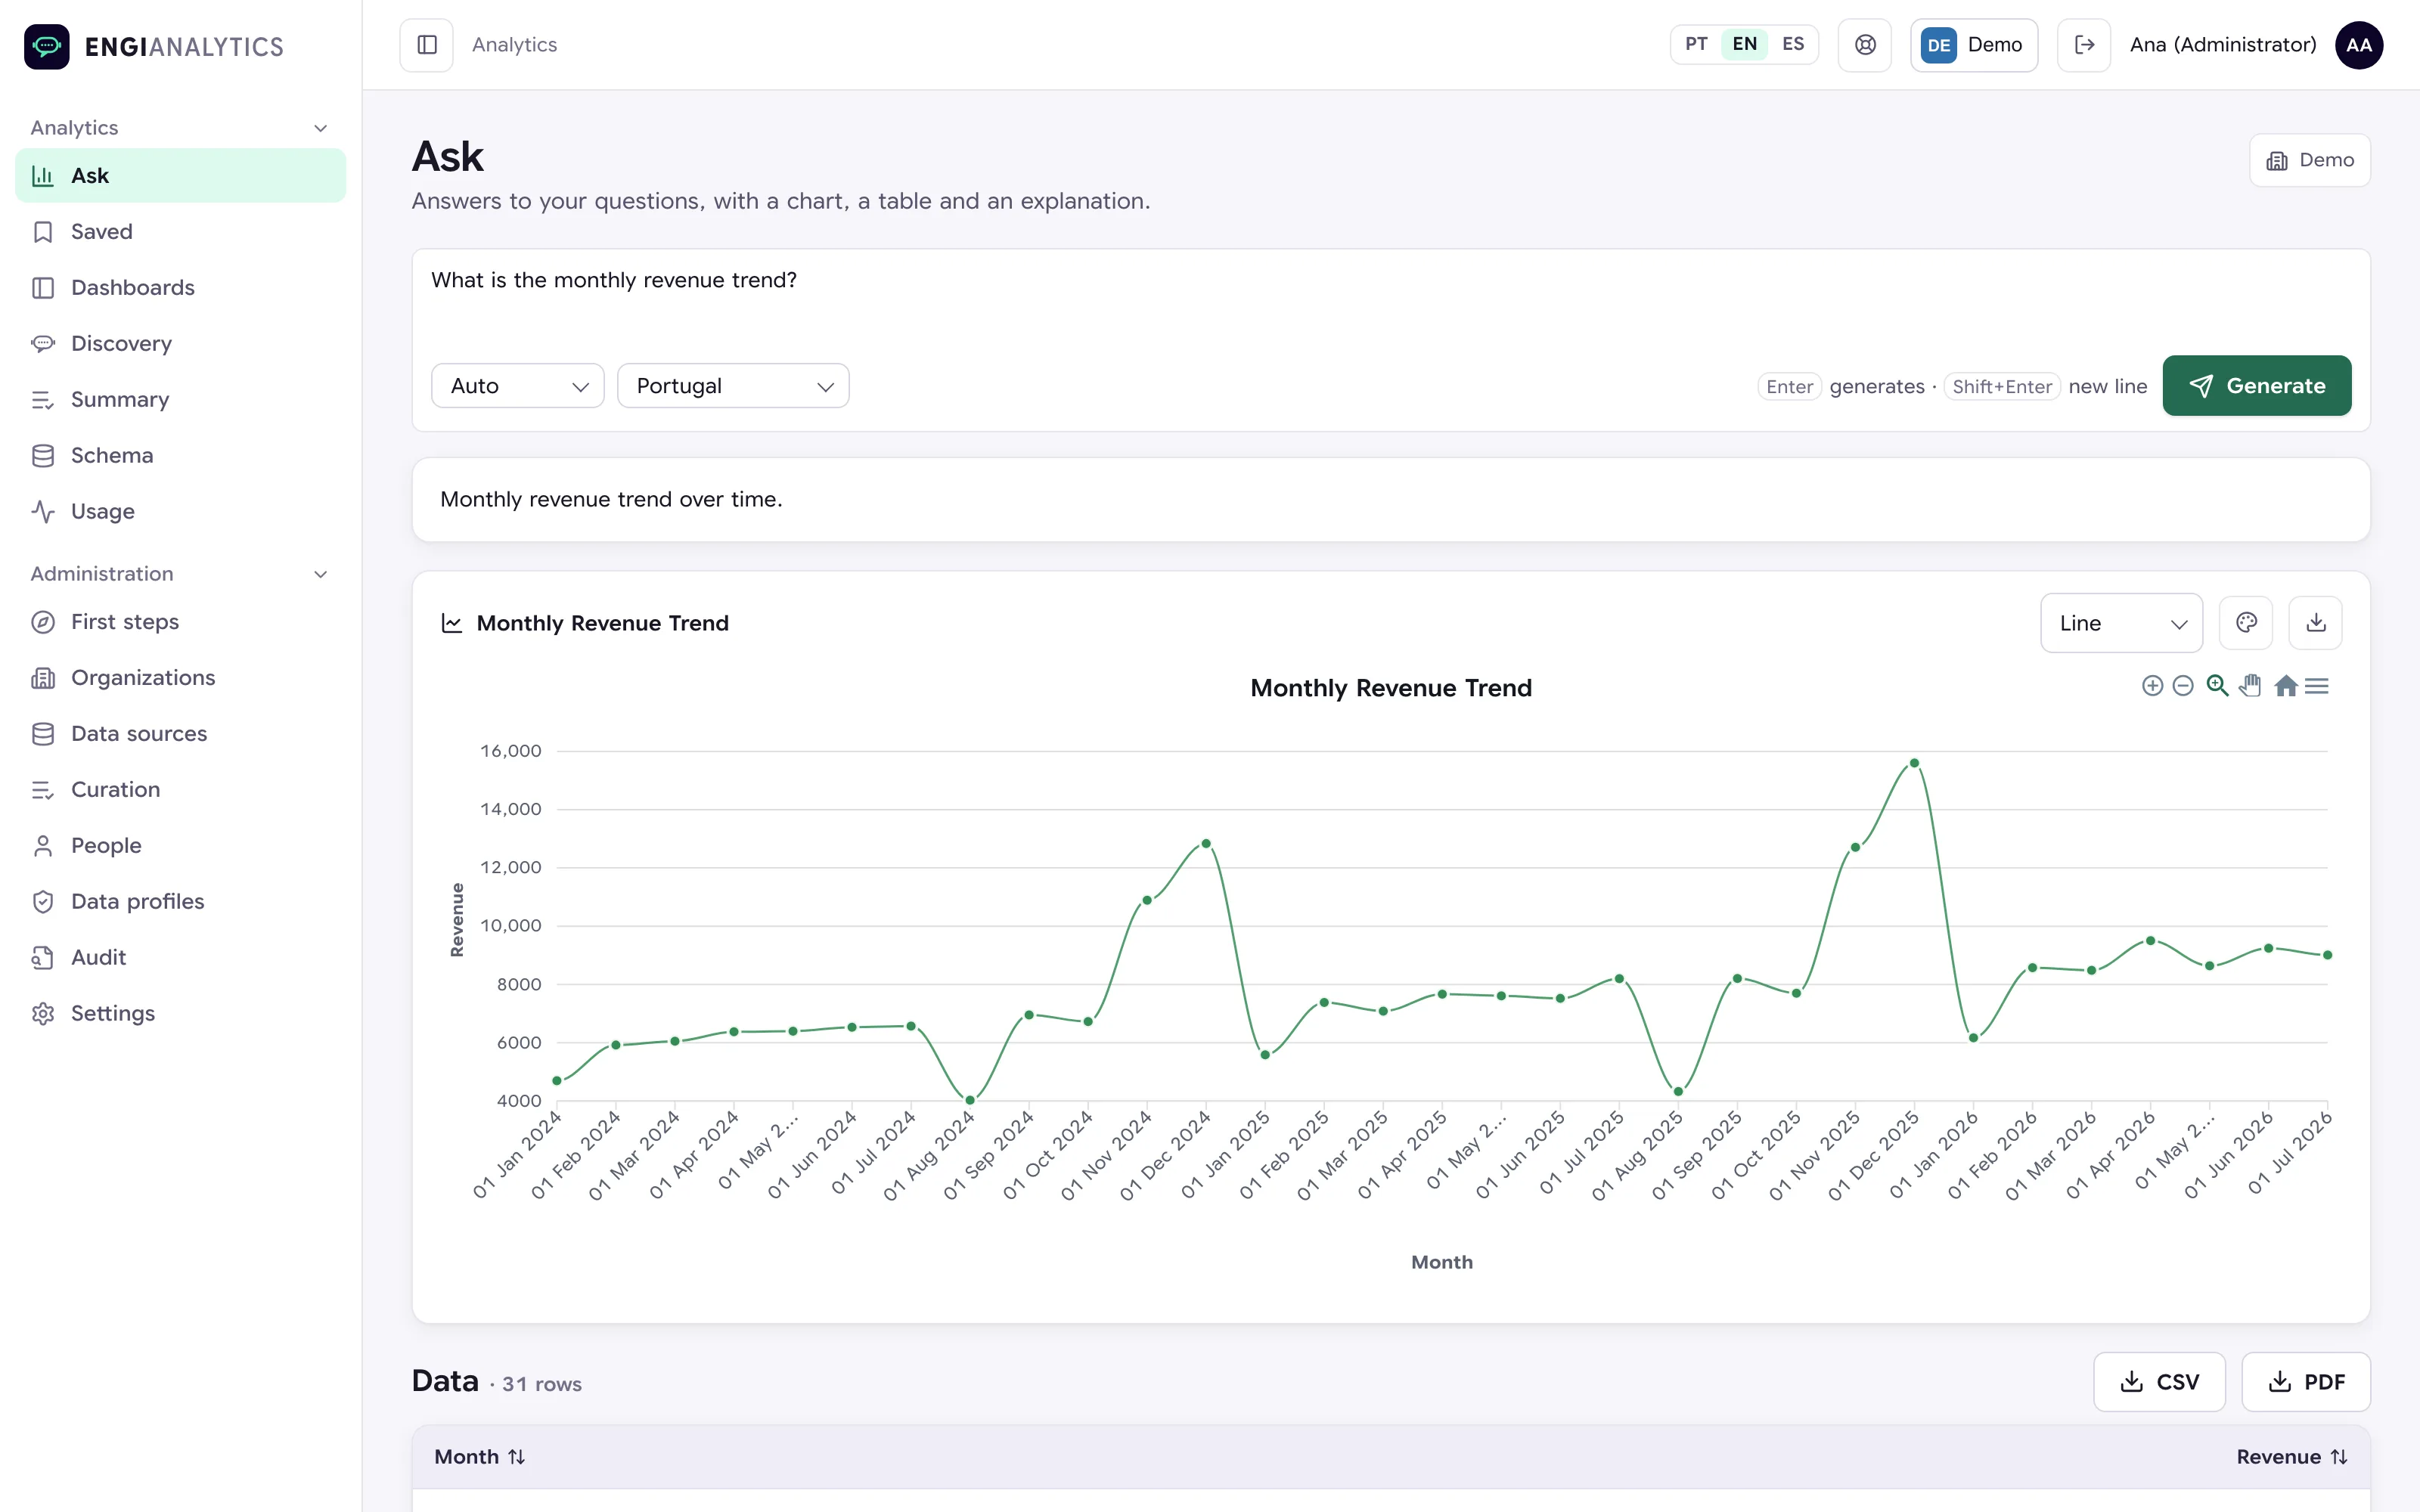
A question written in plain language, the answer with a chart and a table, the query the product wrote, and the dashboard and summary, fed by a daily collection that runs unattended.
Recorded in EngiAnalytics with demonstration data. No narration.
Having the data does not always mean having the answer at hand. Reports and dashboards answer what was anticipated, and today’s questions were rarely anticipated.
Analysts ask in natural language and get the answer right away, in the most suitable format, without depending on the data team. Read-only users open the reports and dashboards already saved.
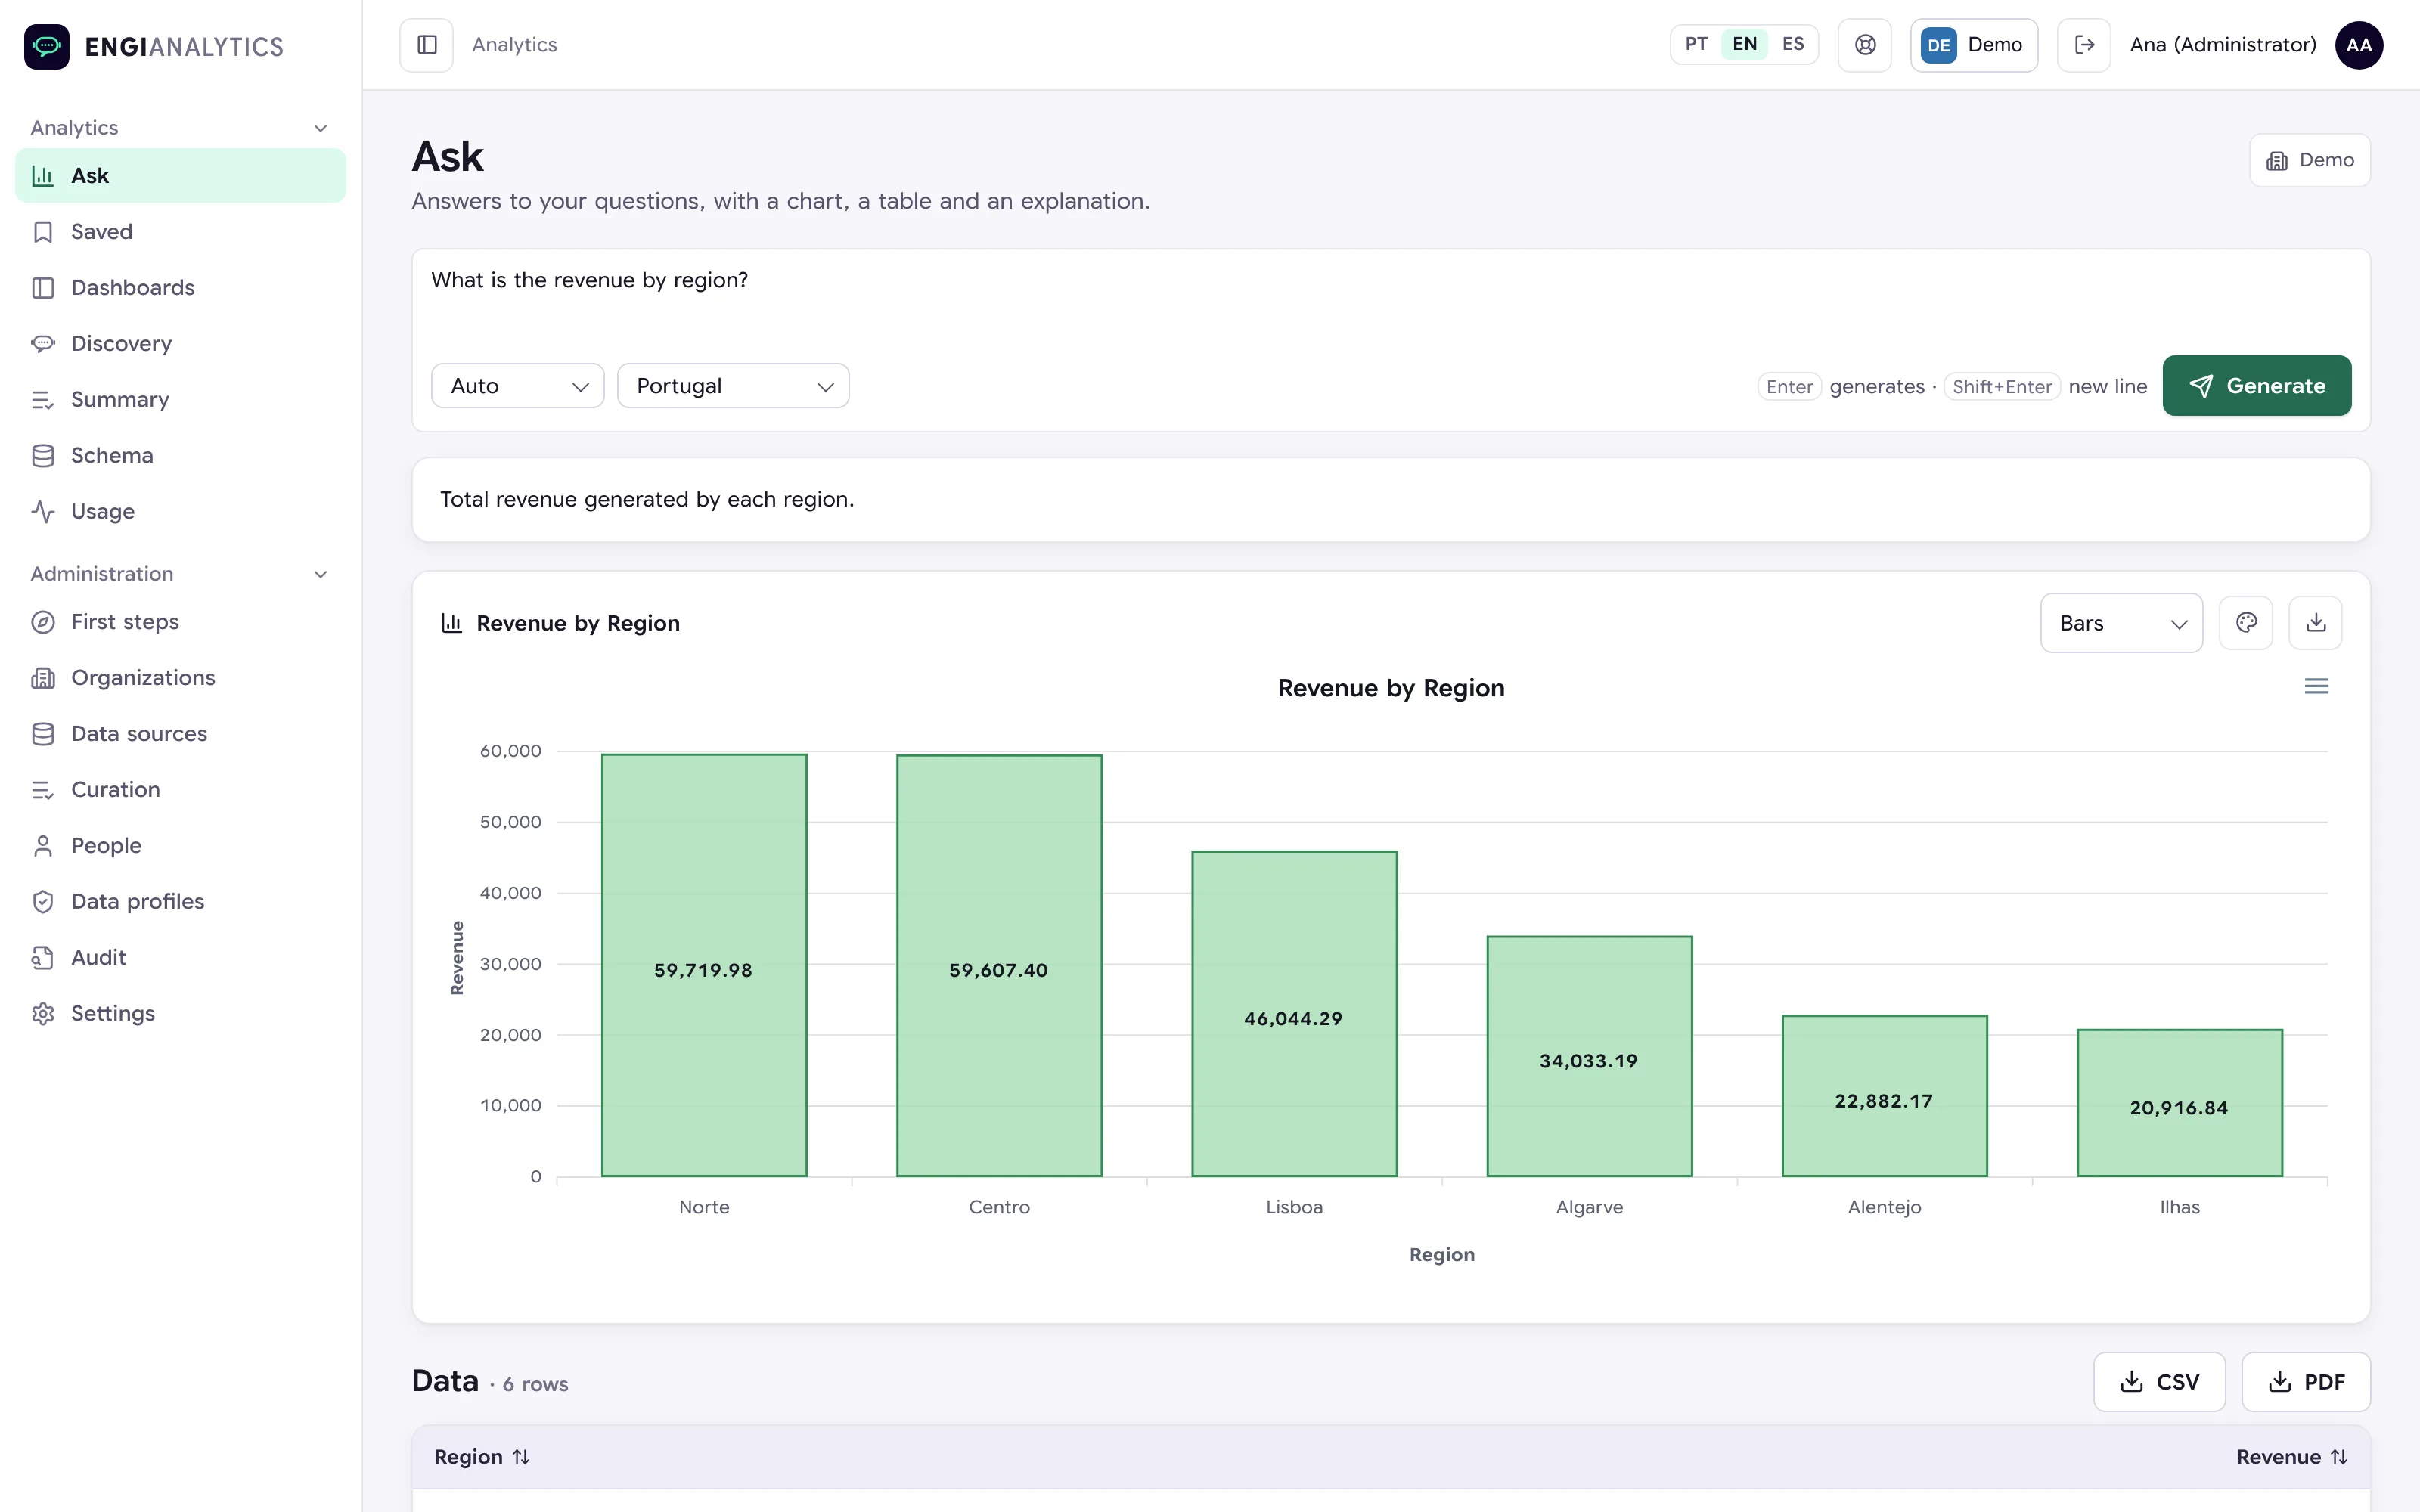
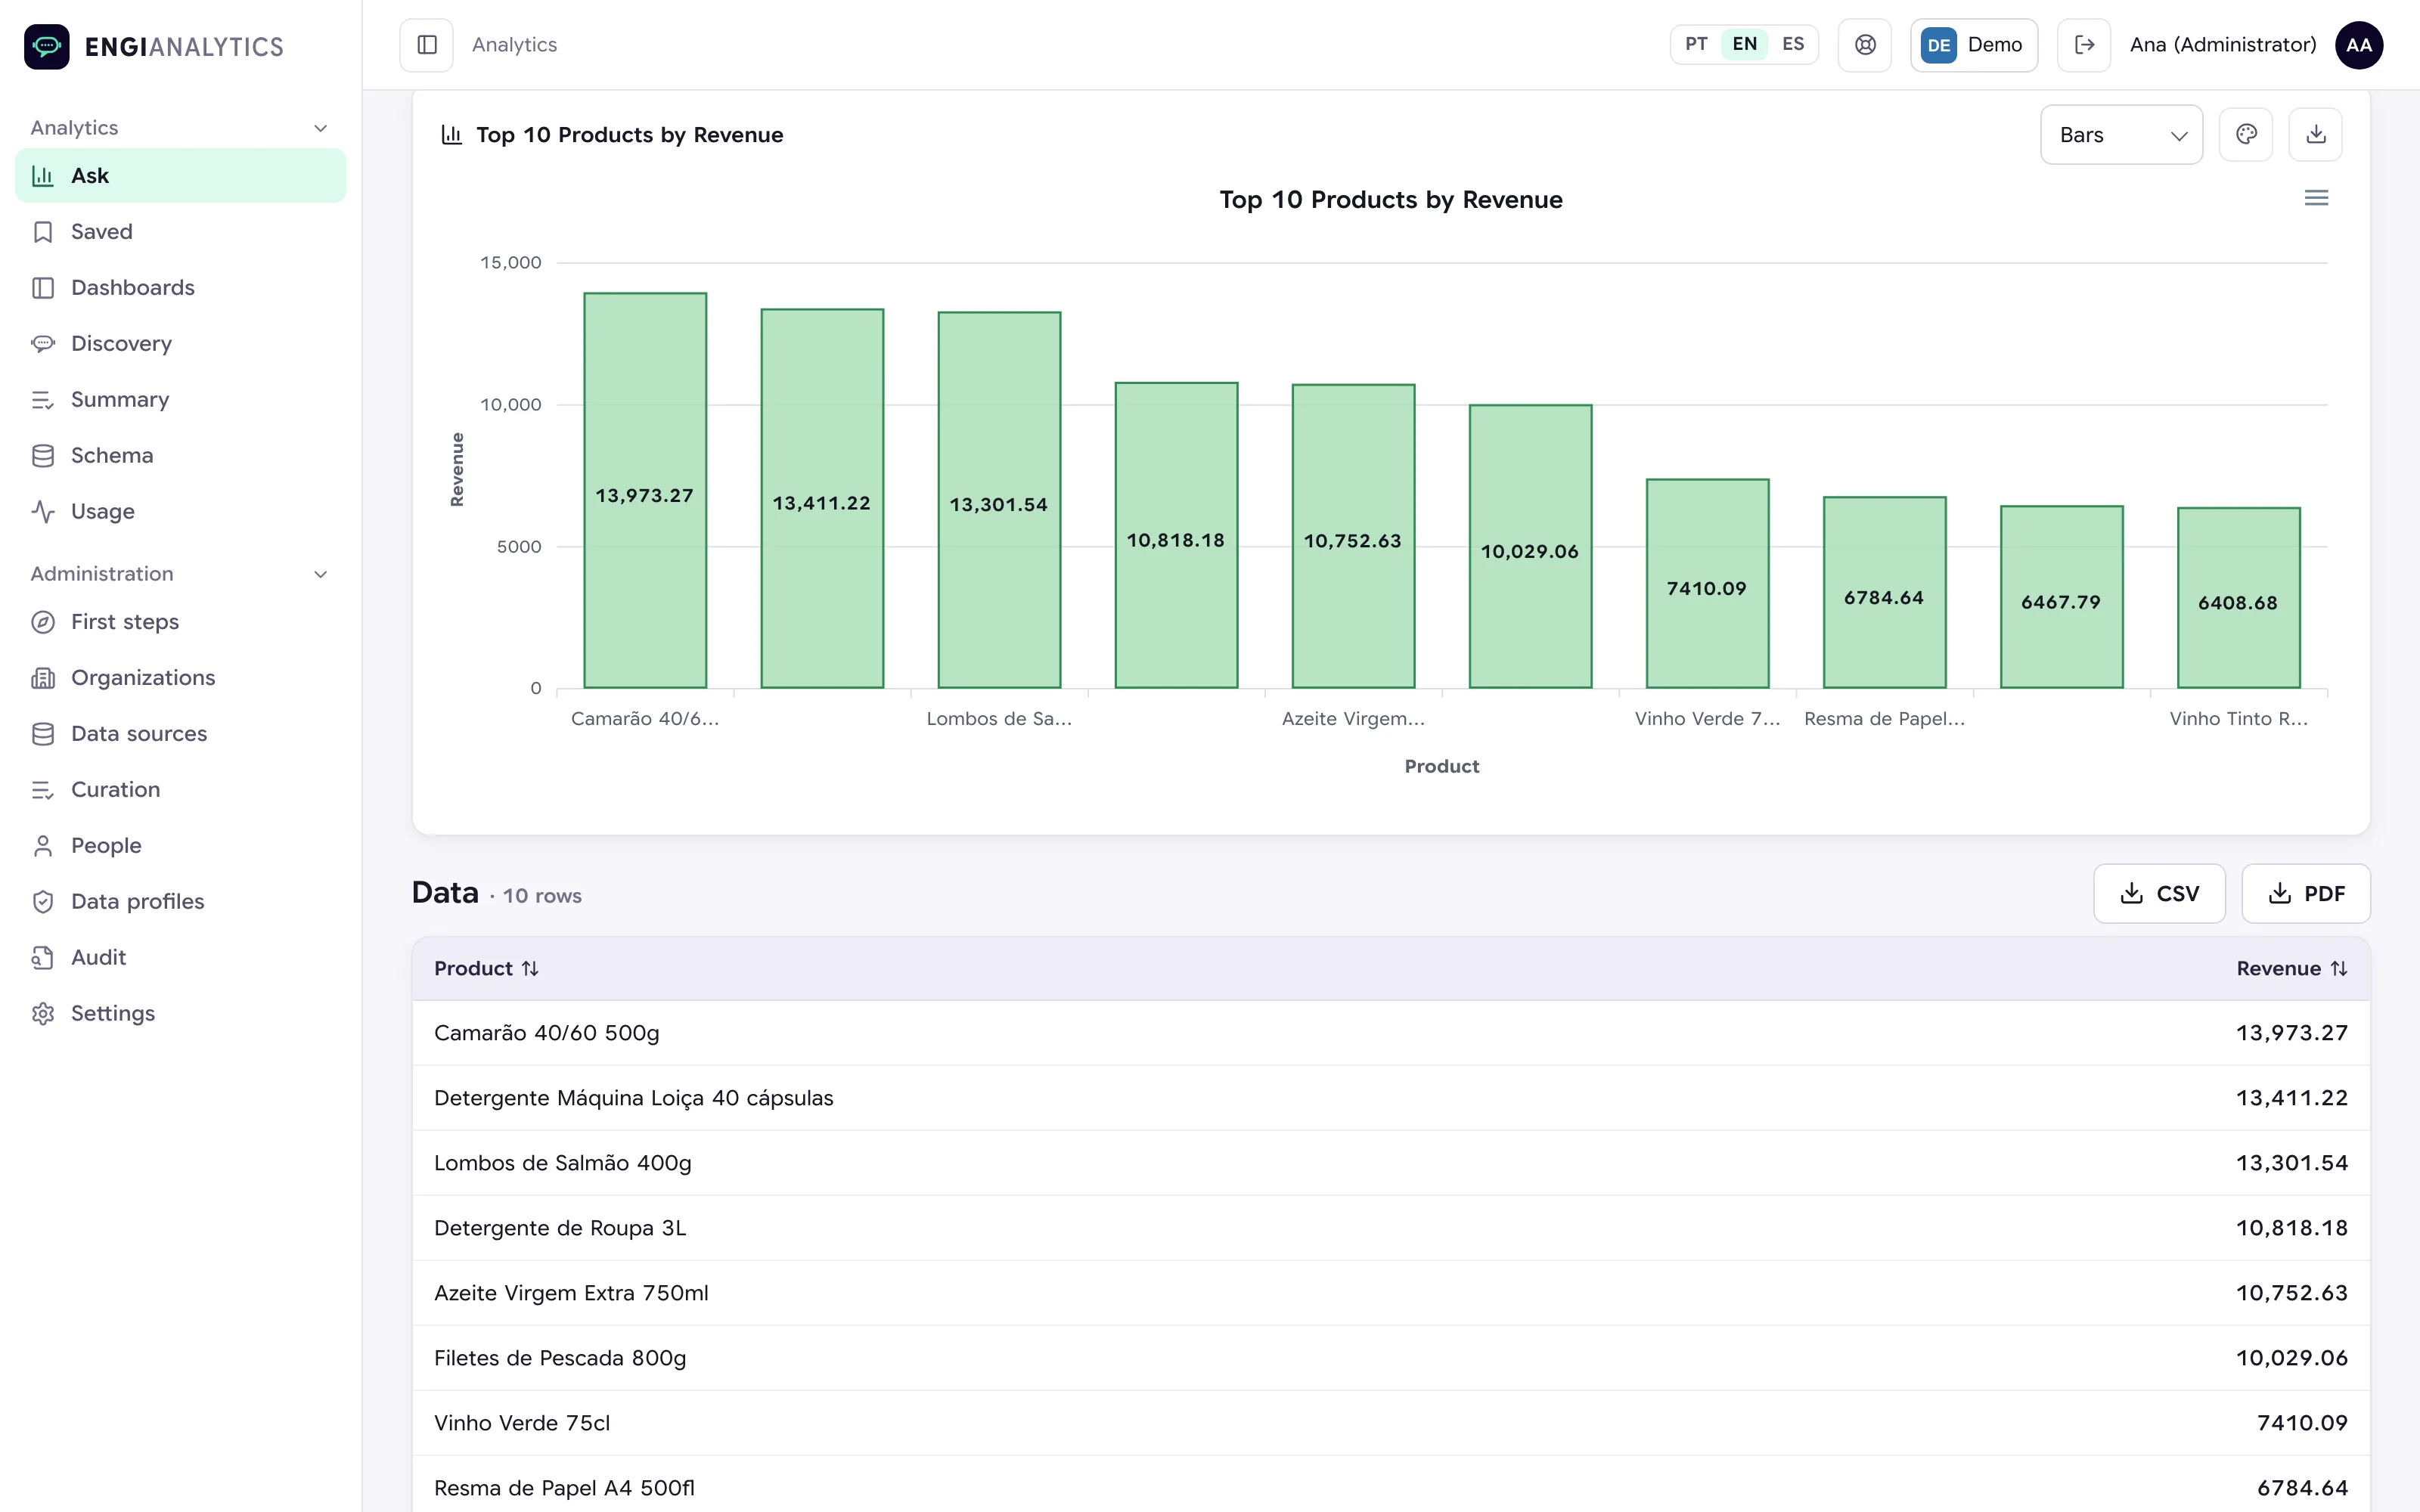
Real screenshots of the product, over a demonstration dataset.
Ask questions as you would ask a colleague. No SQL, no dashboards and no technical knowledge.
The answer arrives in the most suitable format, as a chart, text or table, ready to share. When the question calls for it, as several charts at once.
Every answer comes with a sentence in natural language saying what the query returns. If that sentence quotes a number that is not in the data returned, the reader is warned. For a reading of the numbers, analysts can ask for an analysis of the result.
The SQL query behind each answer can be opened and copied, next to the table with the data returned. That way, any number in the answer can be checked at its source.
Export the data as CSV, the chart as an image or the full report as a PDF, neatly presented and ready to go to whoever decides.
Ask and get answers in Portuguese, Spanish or English, for teams and operations across several countries.
A question answers the moment. Dashboards turn the answers into a continuous reading of the operation.
Each person gathers their reports in a dashboard of their own, which they can share. Indicators show variation and trend, with data refreshed every time it is opened.
EngiAnalytics identifies the business areas present in your data and proposes indicators for each one. It only presents what it has verified in the real data, and accepting a proposal is enough for the indicator to be tracked from day one.
For each tracked indicator, whoever created it can state whether going up is good or bad. With that, the Summary flags the change as positive or negative. Without it, it describes the change without judging it.
Beyond answering questions, EngiAnalytics continuously monitors the data and flags what deserves attention as soon as it detects it.
“3 of the 10 largest clients reduced orders in the last 4 weeks.”
“The average collection period rose by 8 days compared with the previous quarter.”
EngiAnalytics scans the database for inconsistencies and shows what should be corrected before it reaches a report.
A first-steps screen guides setup step by step and shows what the product has already understood from your data, from the business areas to the period available. Some steps are done right there, the others open their own page, and the journey ends with the first result on screen.
No migration and no system replacement, with the control and traceability the operation requires.
It connects to MySQL and PostgreSQL databases, including ERP and CRM databases running on those engines, and to CSV and Excel files, without migration or system replacement.
With several databases connected, the same question can be put to all of them at once, up to five. Each one answers on its own and, when the answers have the same columns, they come together in a single table and a single chart, with one line per source.
Access profiles define, table by table, what each person can query. A question outside that scope is refused immediately, without exposing the restricted information.
Three profiles, Administrator, Analyst and Viewer, each with its own capabilities. Viewers see, administrators decide.
Every question is logged, with who asked, the source, the query run, the number of rows returned, the duration and the outcome, for audit and traceability. The data returned is not stored.
The platform can run on the organisation's infrastructure or on Engibots' infrastructure. When security requirements call for it, the artificial intelligence model can also be hosted on the organisation's infrastructure.
Find out what you could start asking of the data your organisation already has.
Book 20 minutes